Challenge
Solution
Outcome
Scorecards is how New Relic customers hold their engineering organization to a bar: quality, security, ownership, production readiness. It measures services against rules the customer defines and rolls the results into a score. But a score on a dashboard doesn't, by itself, change how teams behave. Our data analysis showed usage was low, and customer conversations told us why: because every rule counted equally, compliance managers couldn't flag what carried the most risk, and engineering teams had no way to tell what to fix first.
Who we designed for
The work served two roles: engineering leaders (primary) and compliance managers (secondary). Each pain point maps to a specific part of the solution:
- Engineering leaders struggle with low standards adoption across teams. Levels and a team leaderboard turn improvement into visible progress and healthy competition.
- Compliance managers can't express what matters most. Configurable weights let them prioritize the rules that carry the most risk, so a score reflects real priorities rather than counting every rule equally.
- Leaders lack a read on where to invest. Maturity distribution and trends over time pinpoint the teams and services that need support to reach the next level.
Approach
Rather than rebuild Scorecards to match how competitors do gamification, we layered it onto the model New Relic already had. That meant three connected moves —
- Maturity levels to give teams something to climb,
- Weights to give rules different priorities, and
- A leaderboard to turn progress into healthy competition.
The hard part was fitting each onto a rule-based model that was never designed for leveling. The sections below walk through how.
How Scorecards actually work
Every design decision came back to one thing: how a scorecard actually gets scored. It works like this:
- A Scorecard is a set of rules.
- Each rule is a query that checks a group of entities (services, browser apps, and so on) and marks each one pass or fail.
- A rule's score is entities passed ÷ entities checked, and the scorecard's score is the average of its rules.
A more flexible model, a harder problem
How competitors do it
Before designing anything, I benchmarked Cortex, Rely.io, and Port. All three gamify Scorecards the same way: a service attaches directly to a scorecard and climbs named levels (Bronze → Silver → Gold) as it passes more of that scorecard's checks. The level lives on the entity, scoped to one scorecard.
Why that doesn't work for New Relic
- Entities aren't scored by a scorecard directly — they're scored by its rules.
- A service isn't simply "in" a scorecard the way it is in Cortex; it sits in the intersection of that scorecard's rules.
- That's deliberate: rule-level scoring is what lets customers compose rules freely and reuse entities across scorecards. But it also means there's no single "level" baked into a scorecard for an entity to climb — the flexibility that makes the model powerful is exactly what made leveling hard.
Competitors
The entity attaches directly to a scorecard, so its level (Bronze, Silver, or Gold) is just an attribute there.
New Relic
Entities are scored through rules, so there is no single entity level to attach a badge to.
How a team levels up
If entities are scored through rules, the rule is the only place a level can live. So working with the PM, EM, and the team's architect, we attached leveling to the rule, not the scorecard:
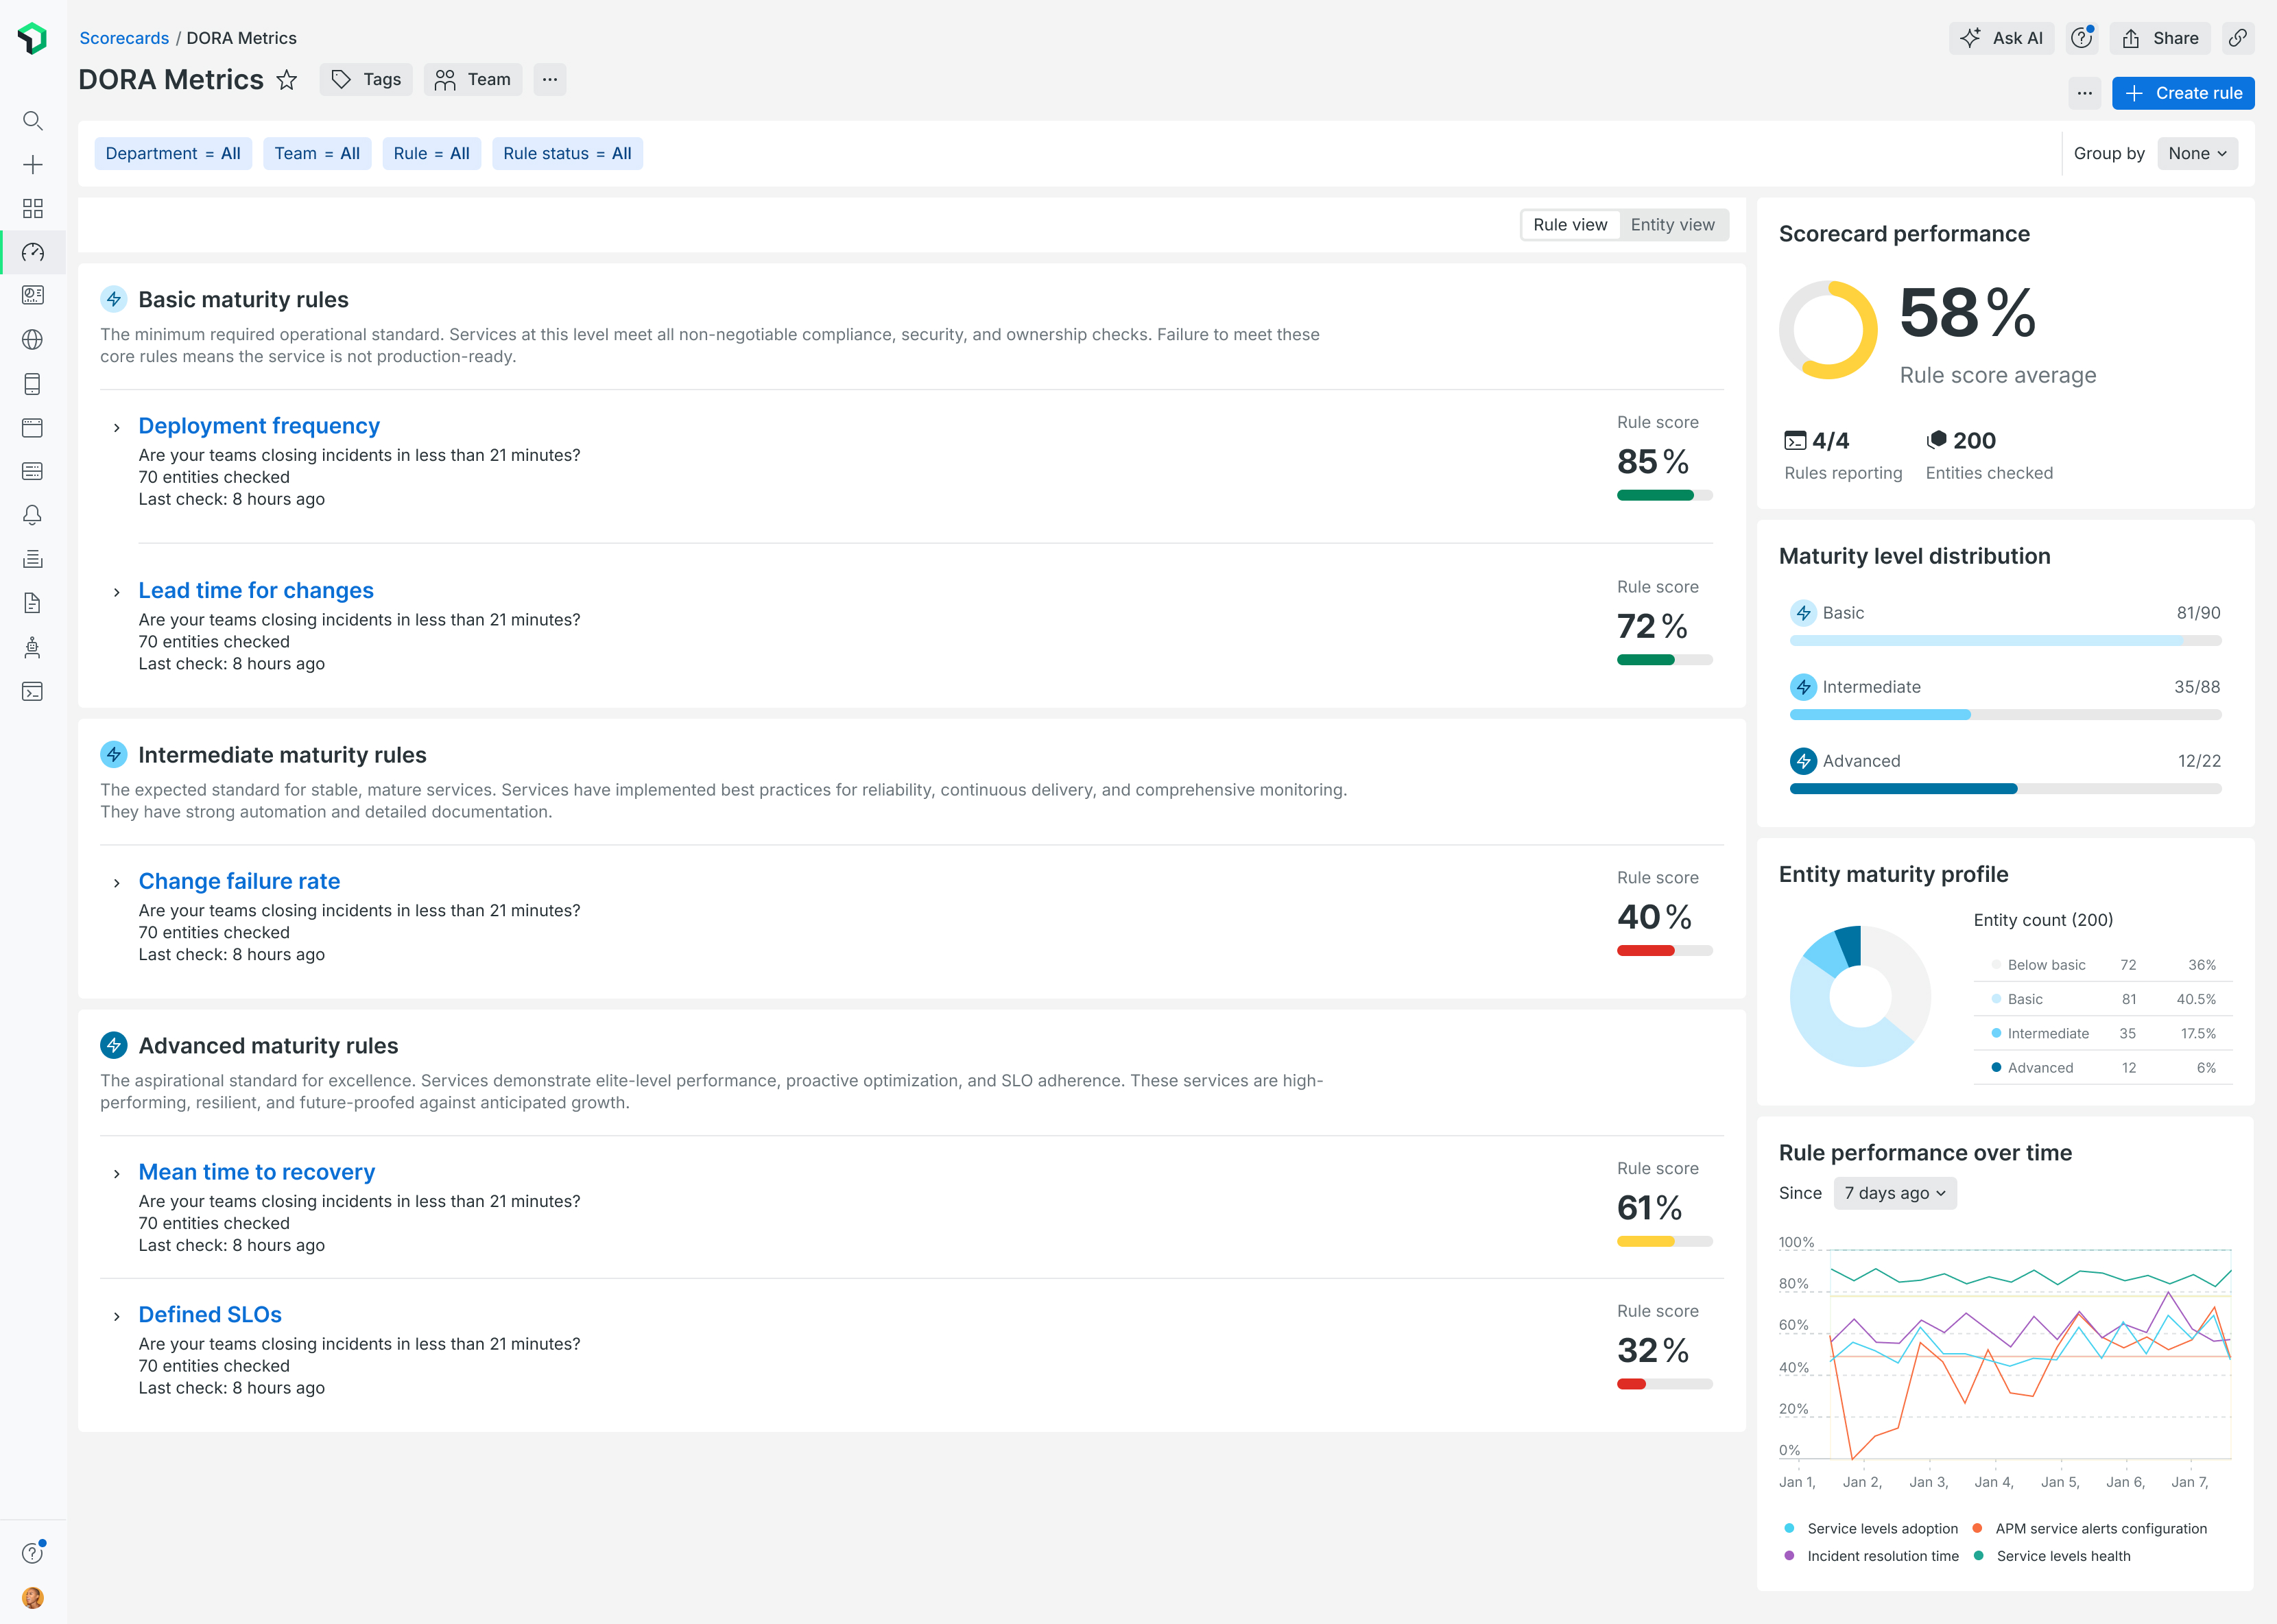
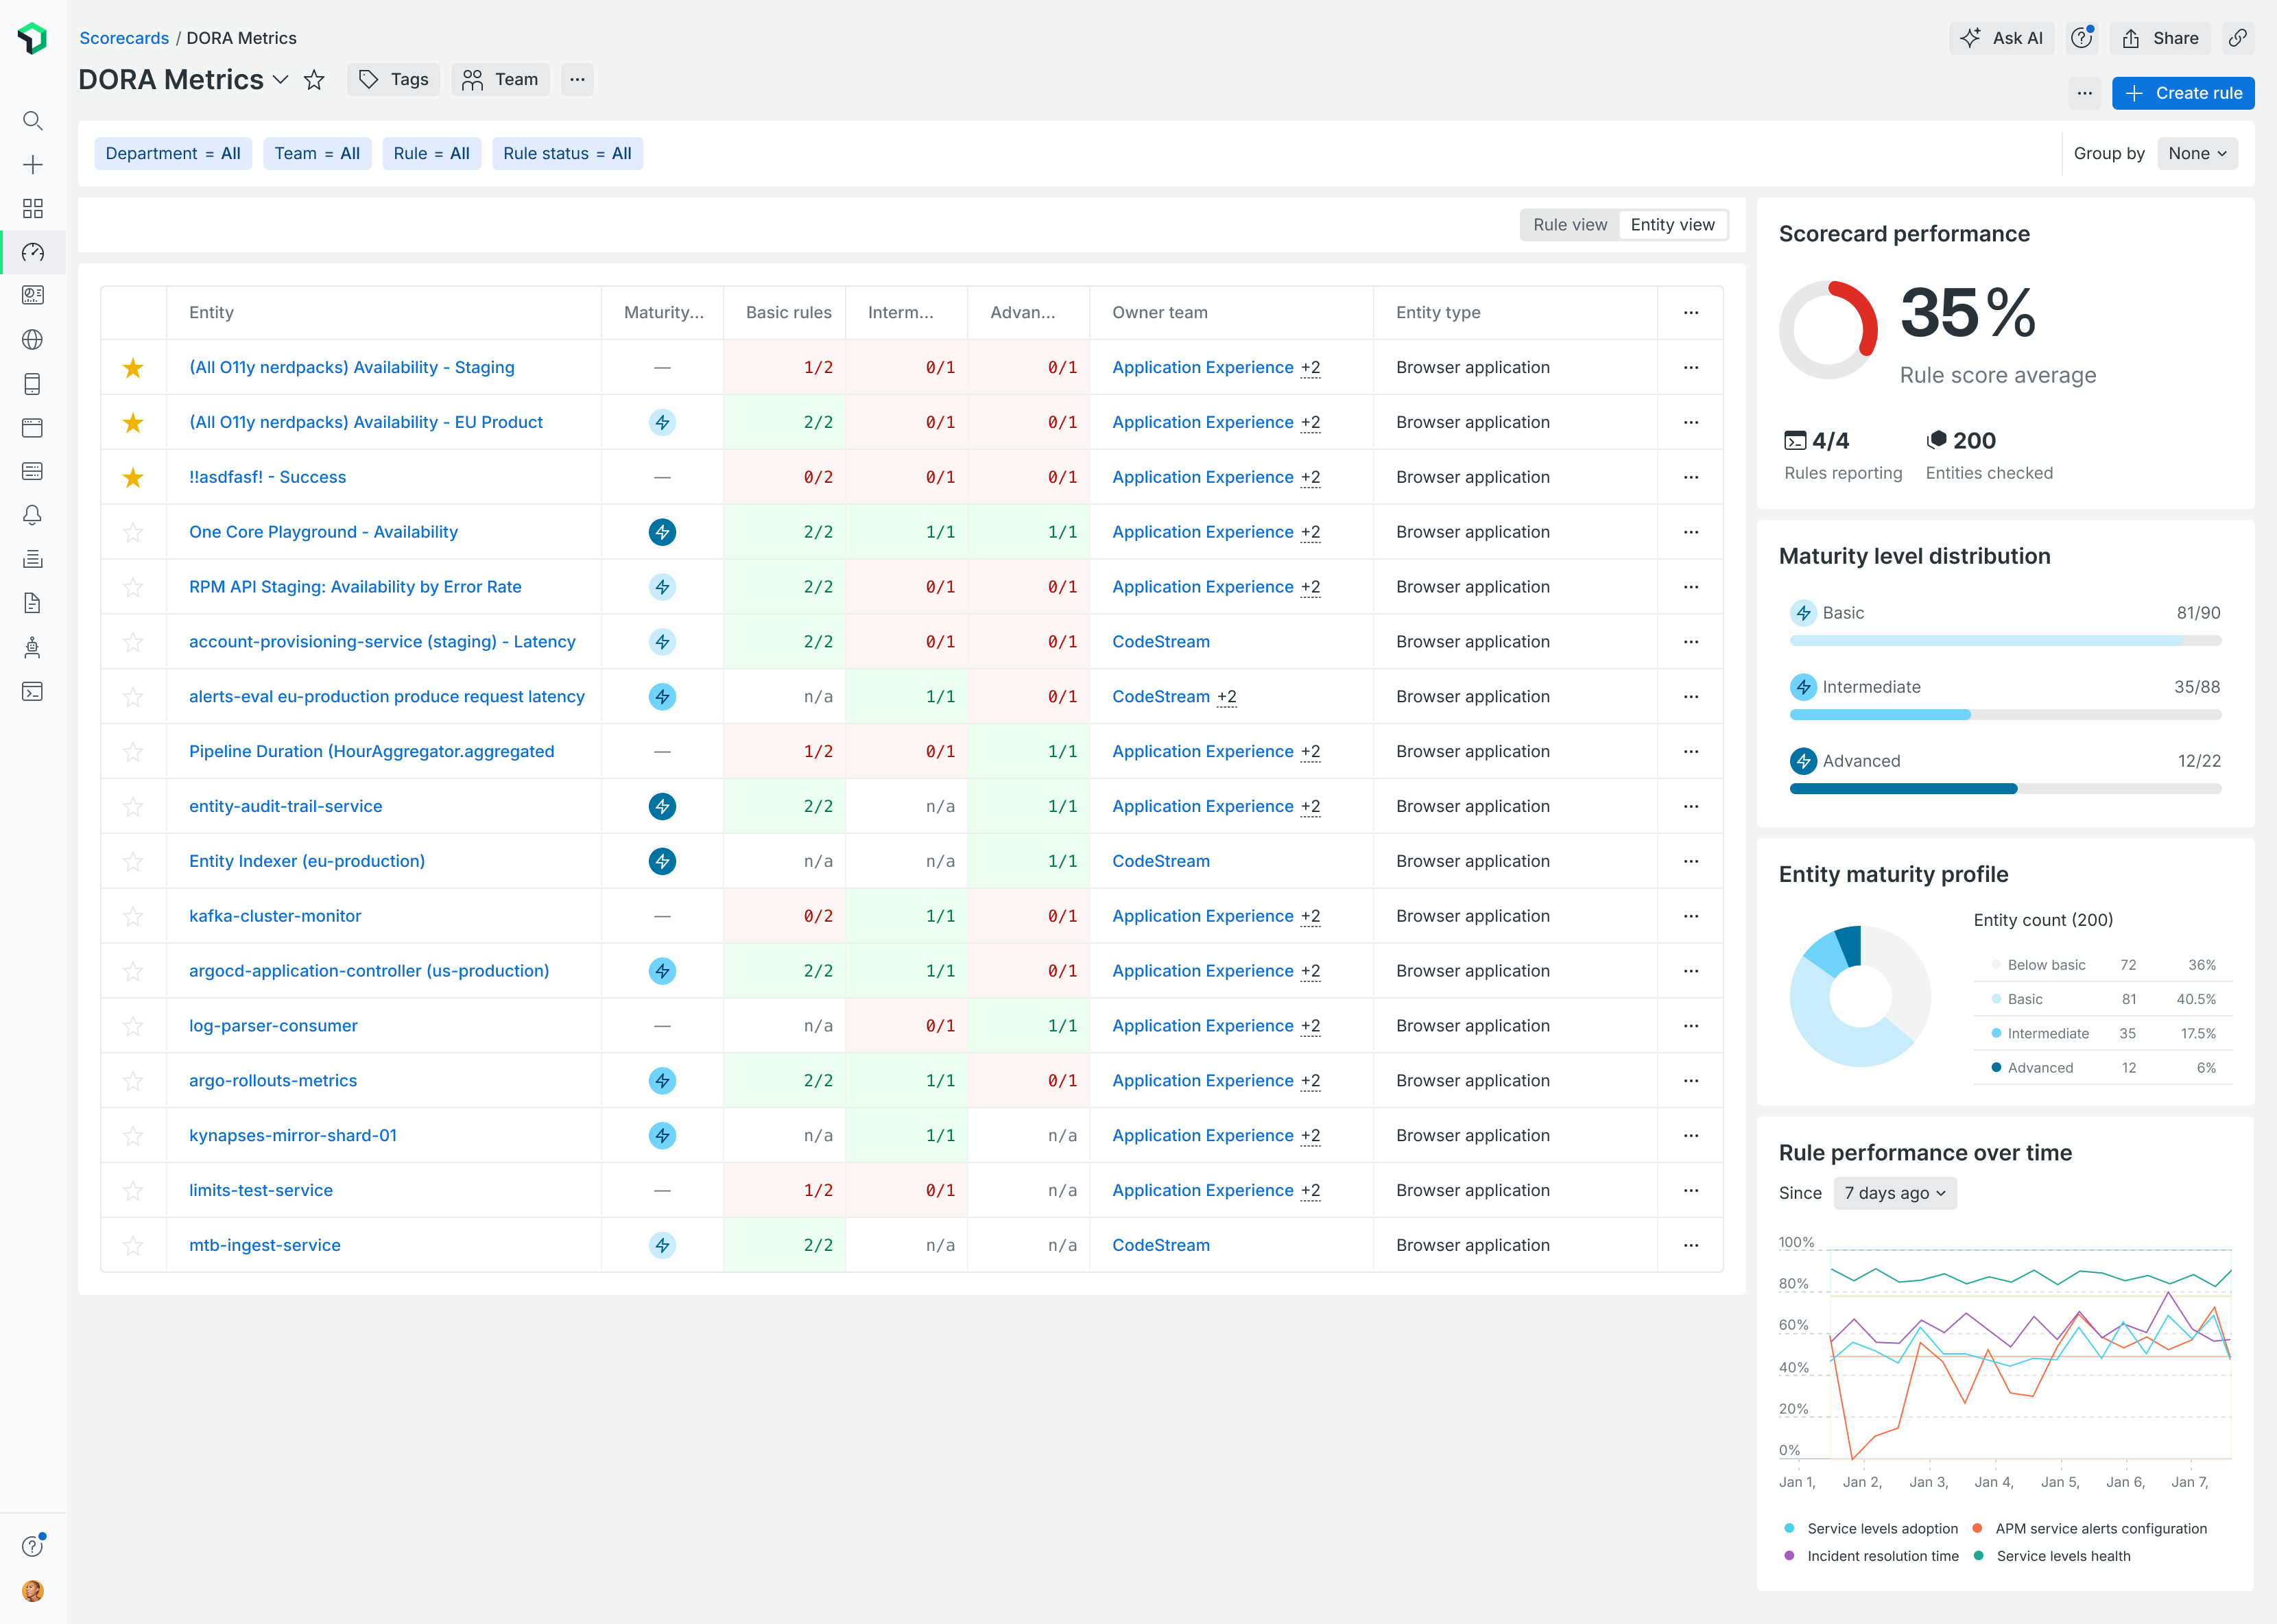
- Each rule in a scorecard is assigned to a maturity level: Below basic, Basic, Intermediate, or Advanced.
- An entity's maturity level is the highest level whose rules it's passing, so progress is something a team can actually climb.
- Weights, set up through the API, let a compliance manager mark which rules matter most, so the score and the level reflect real priorities rather than treating every rule as equal.
I designed the setup flow: an author drags each rule into the level it belongs to.
Designing how teams compare (iterations and testing)
Levels and weights answered how a team makes progress. The leaderboard asked a different question: when we crown a team, what exactly are we ranking? It's the piece that changed the most between my early explorations and what shipped.
Most of my early directions leaned into richness, each trying a different way to pack in badges, levels, and per-rule detail:
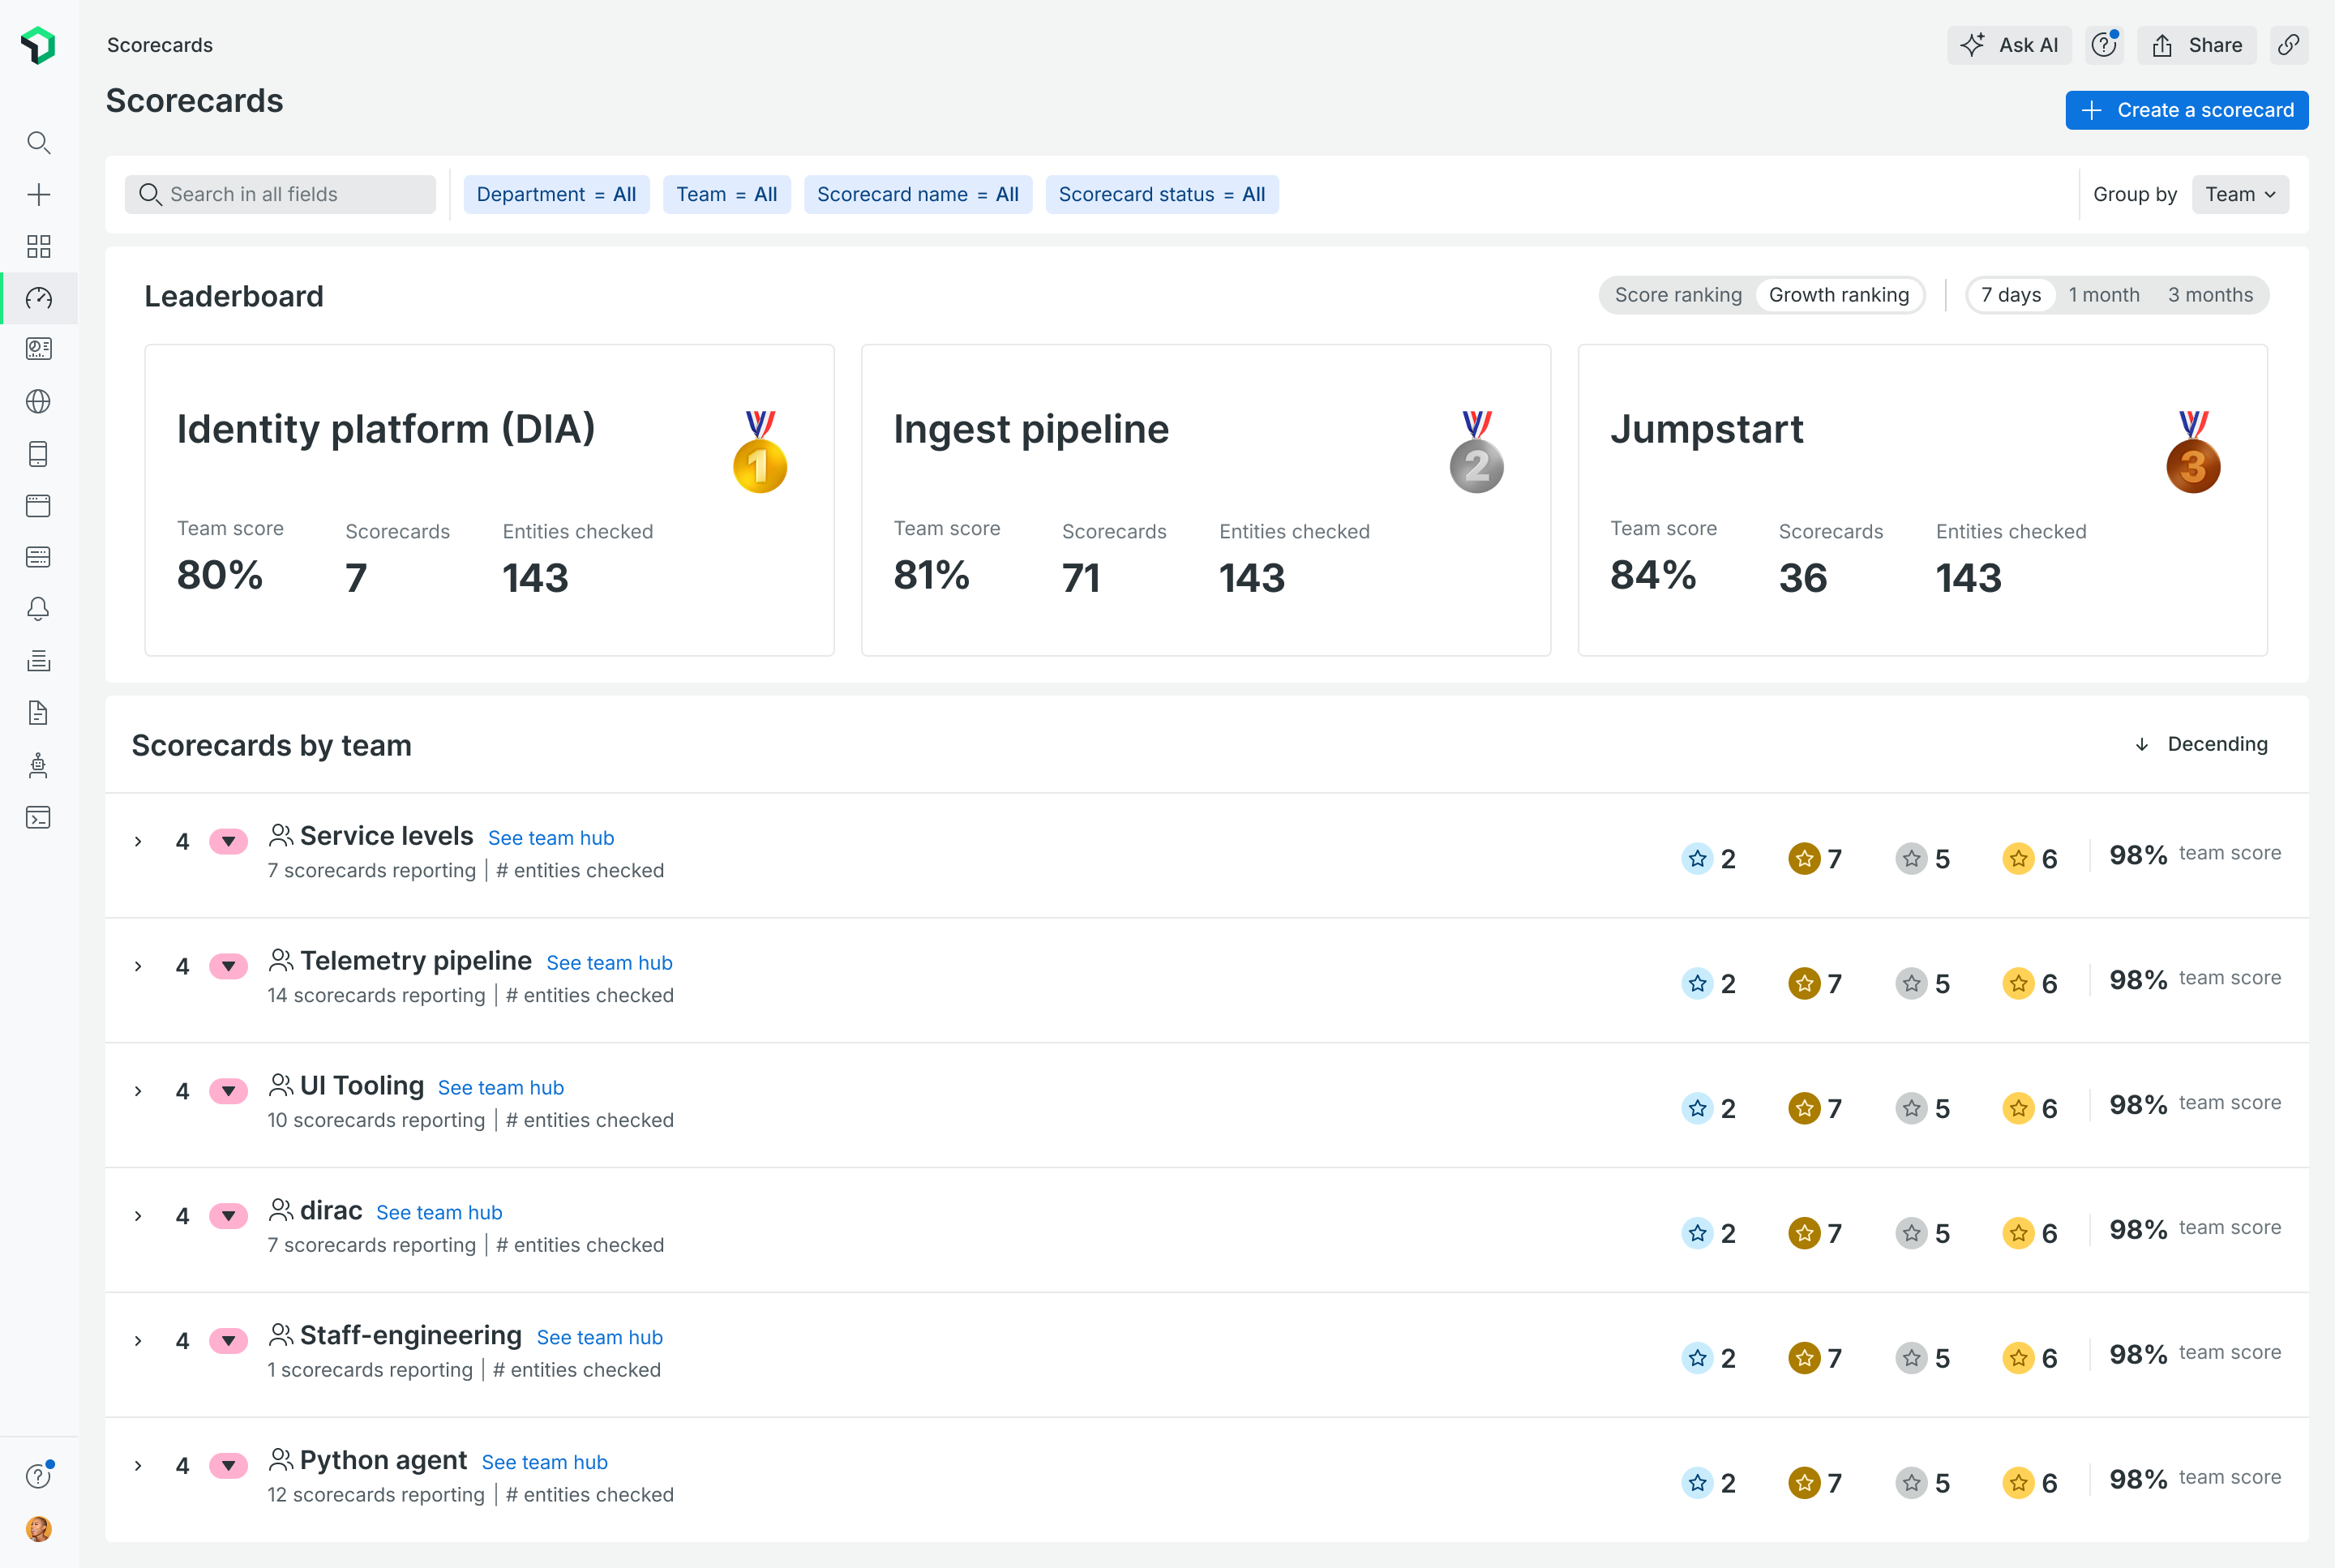
A. Medals + badge counts
A podium plus a row of badge counts per level. Showed breadth of achievement, but counting badges rewarded teams that simply owned more scorecards, and the row was busy to read.
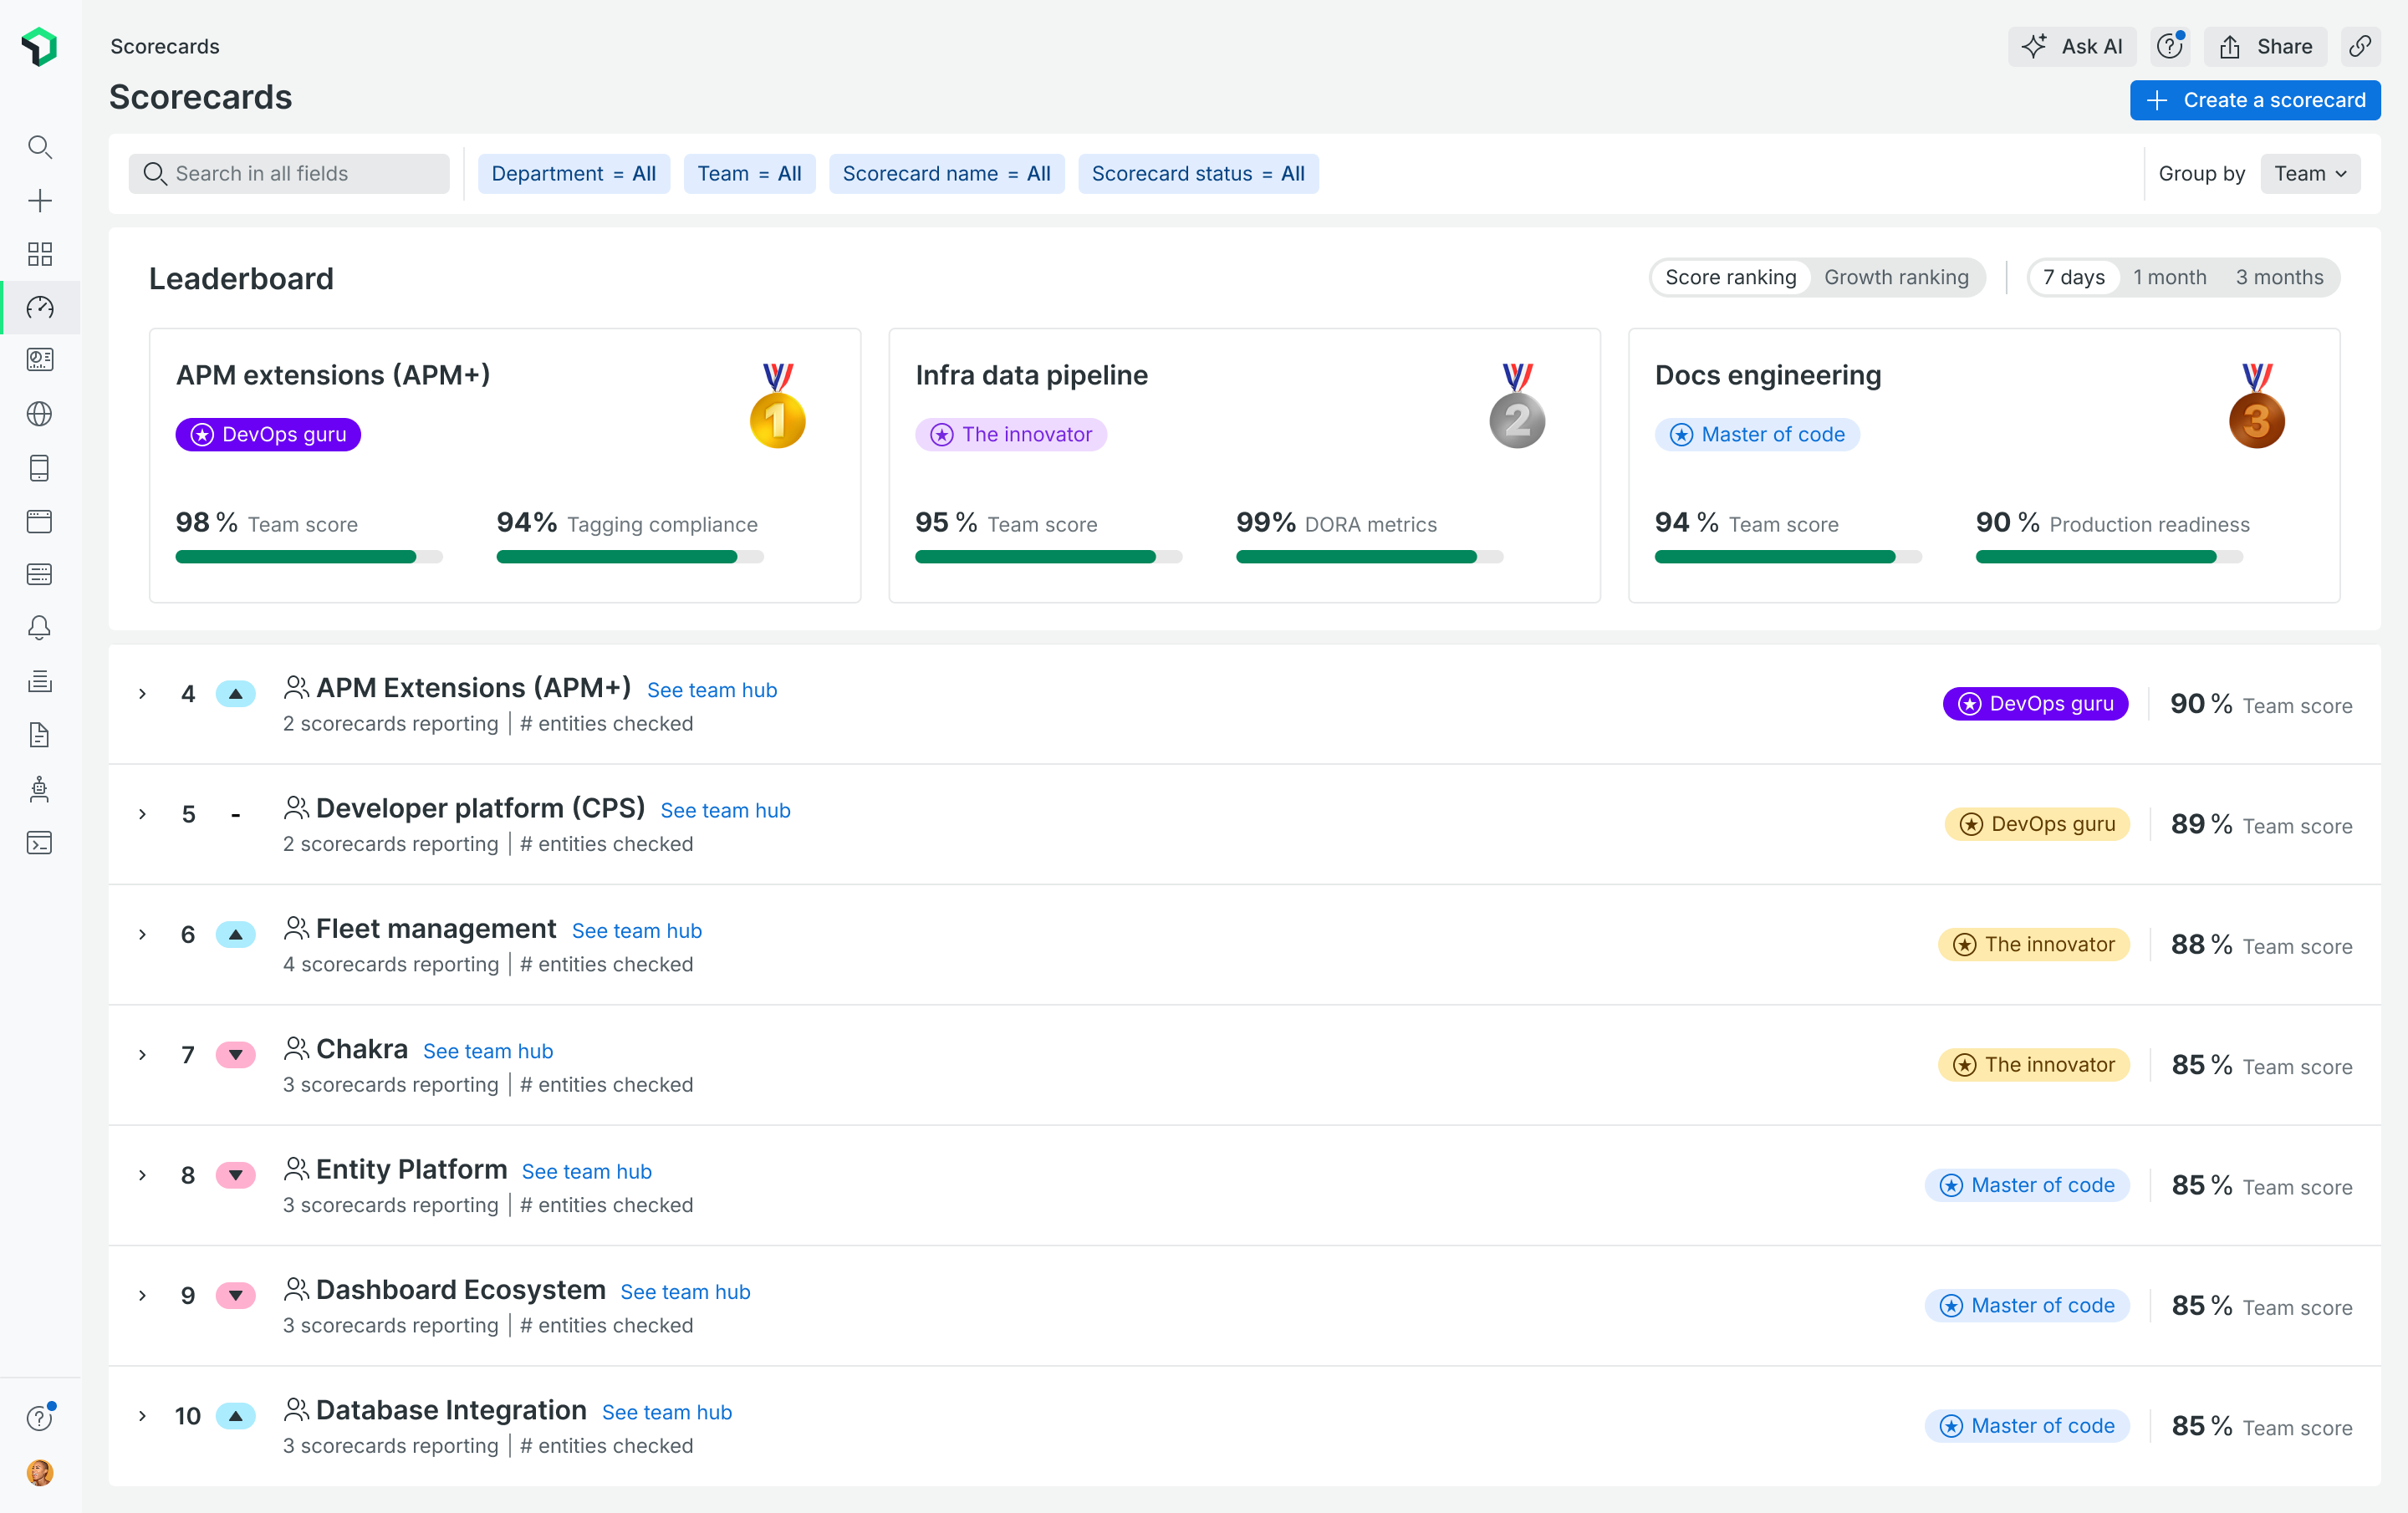
B. Named tier badges
Memorable identities like “DevOps guru” or “The innovator.” Characterful, but the label needed decoding, and pairing it with rank numbers and scores was hard to correlate.
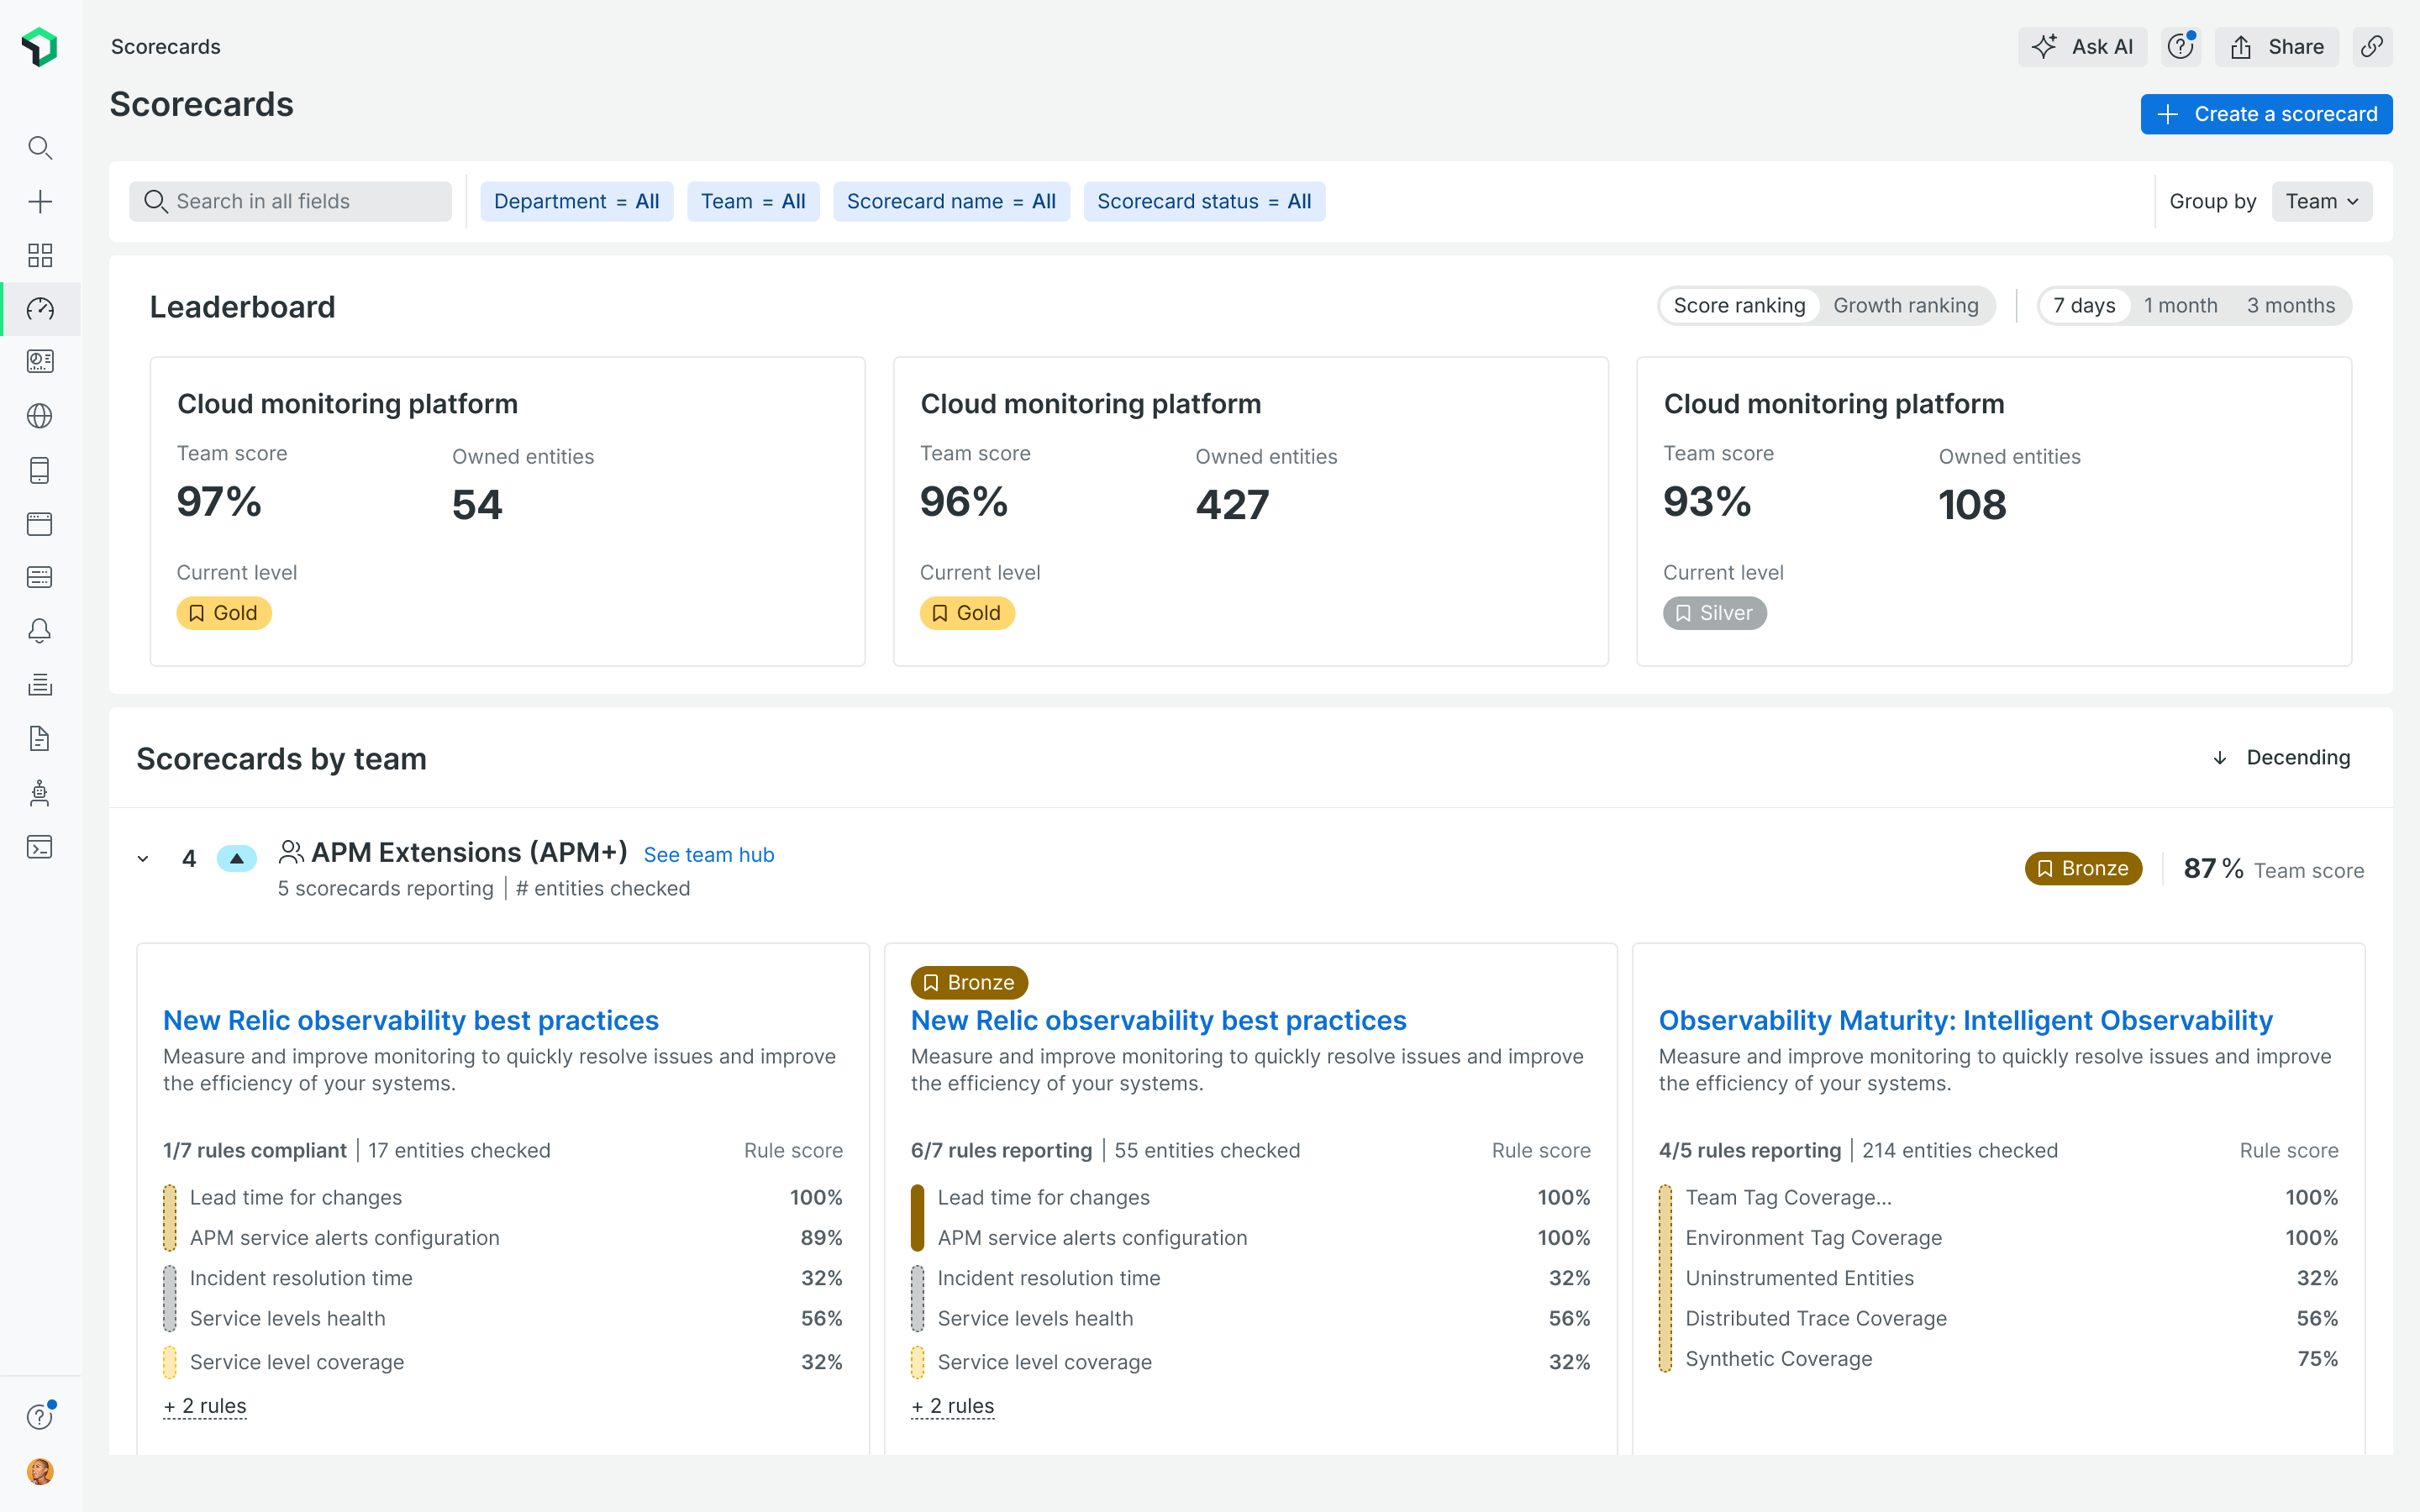
C. Badge transparency
Level encoded with filled vs. faded badges, expandable to per-rule detail. Precise, but the transparency states were subtle and the detail dense.
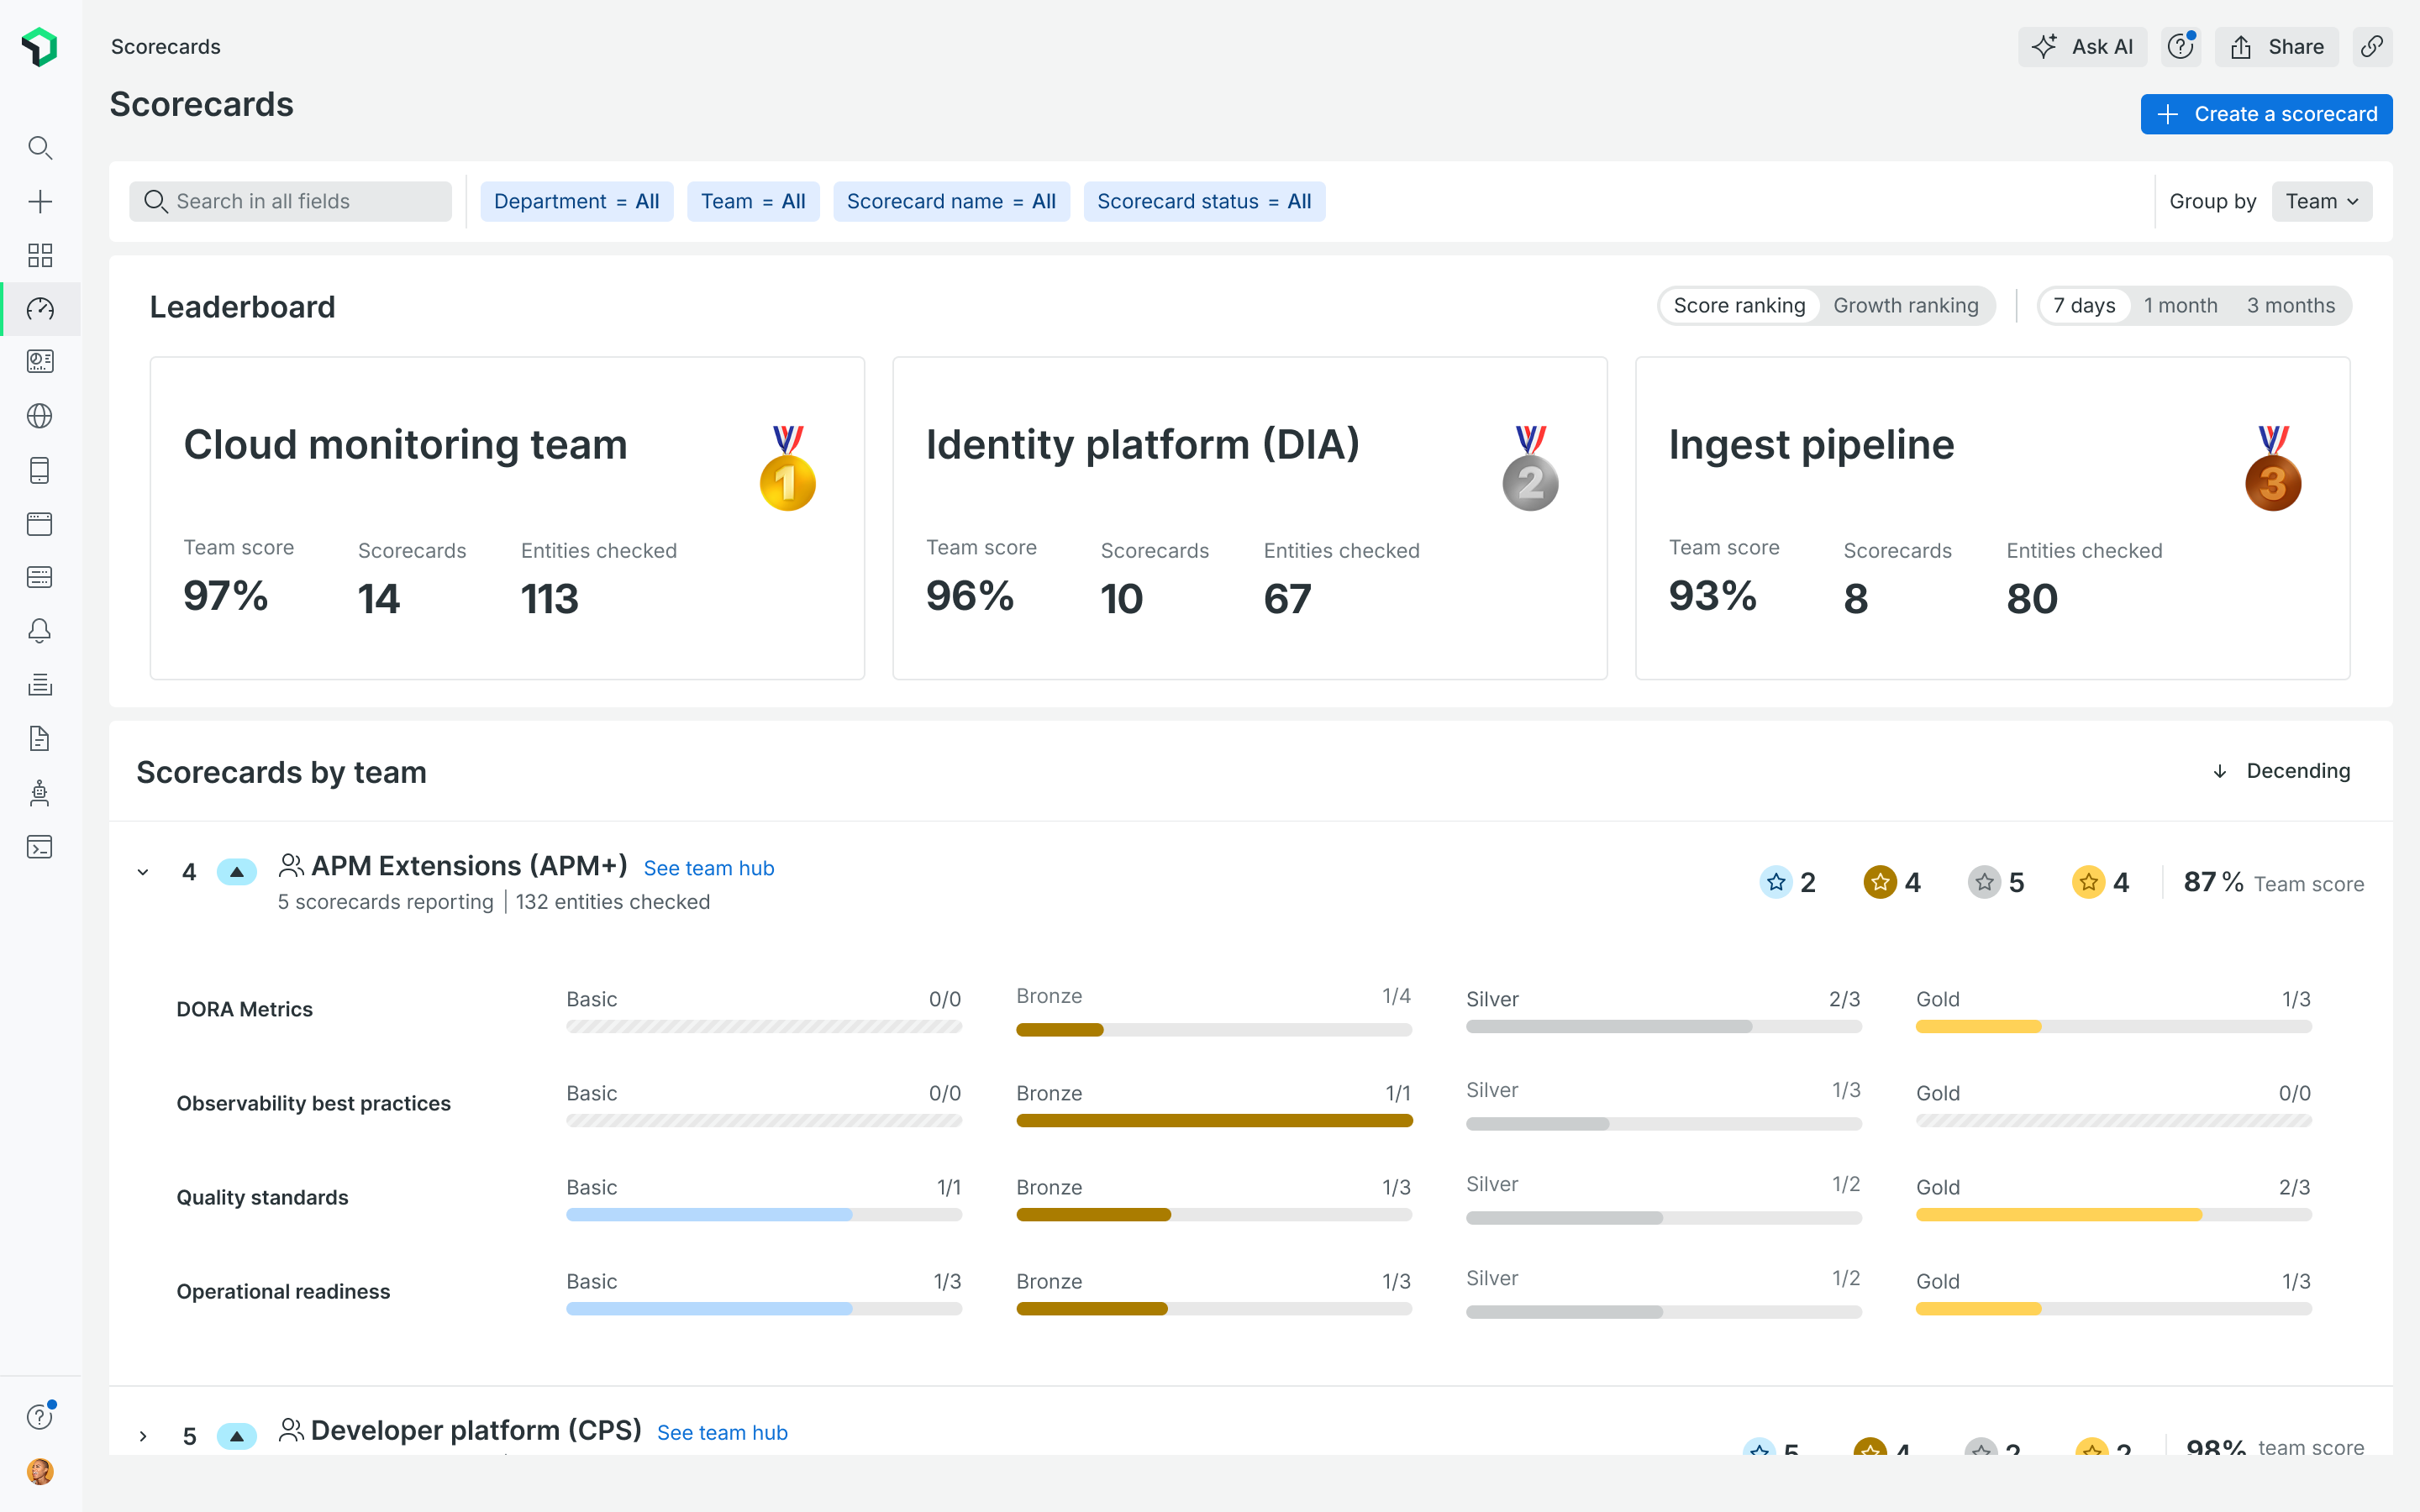
D. Per-level bar charts
Every scorecard broken into Basic / Bronze / Silver / Gold bars. The most detailed design, and the hardest to scan; it makes it hard to know who's ahead.
A quick round of internal testing made the pattern clear. Even engineering managers, the people closest to this data, struggled to connect the badges, icons, and numbers to what they actually meant.
What shipped
The design shipped as a connected set of capabilities:
- Maturity levels — rules assigned to Below basic → Advanced, so teams have a level to climb rather than a flat percentage.
- Configurable weights — compliance managers prioritize the rules that carry the most risk, so the score reflects what actually matters.
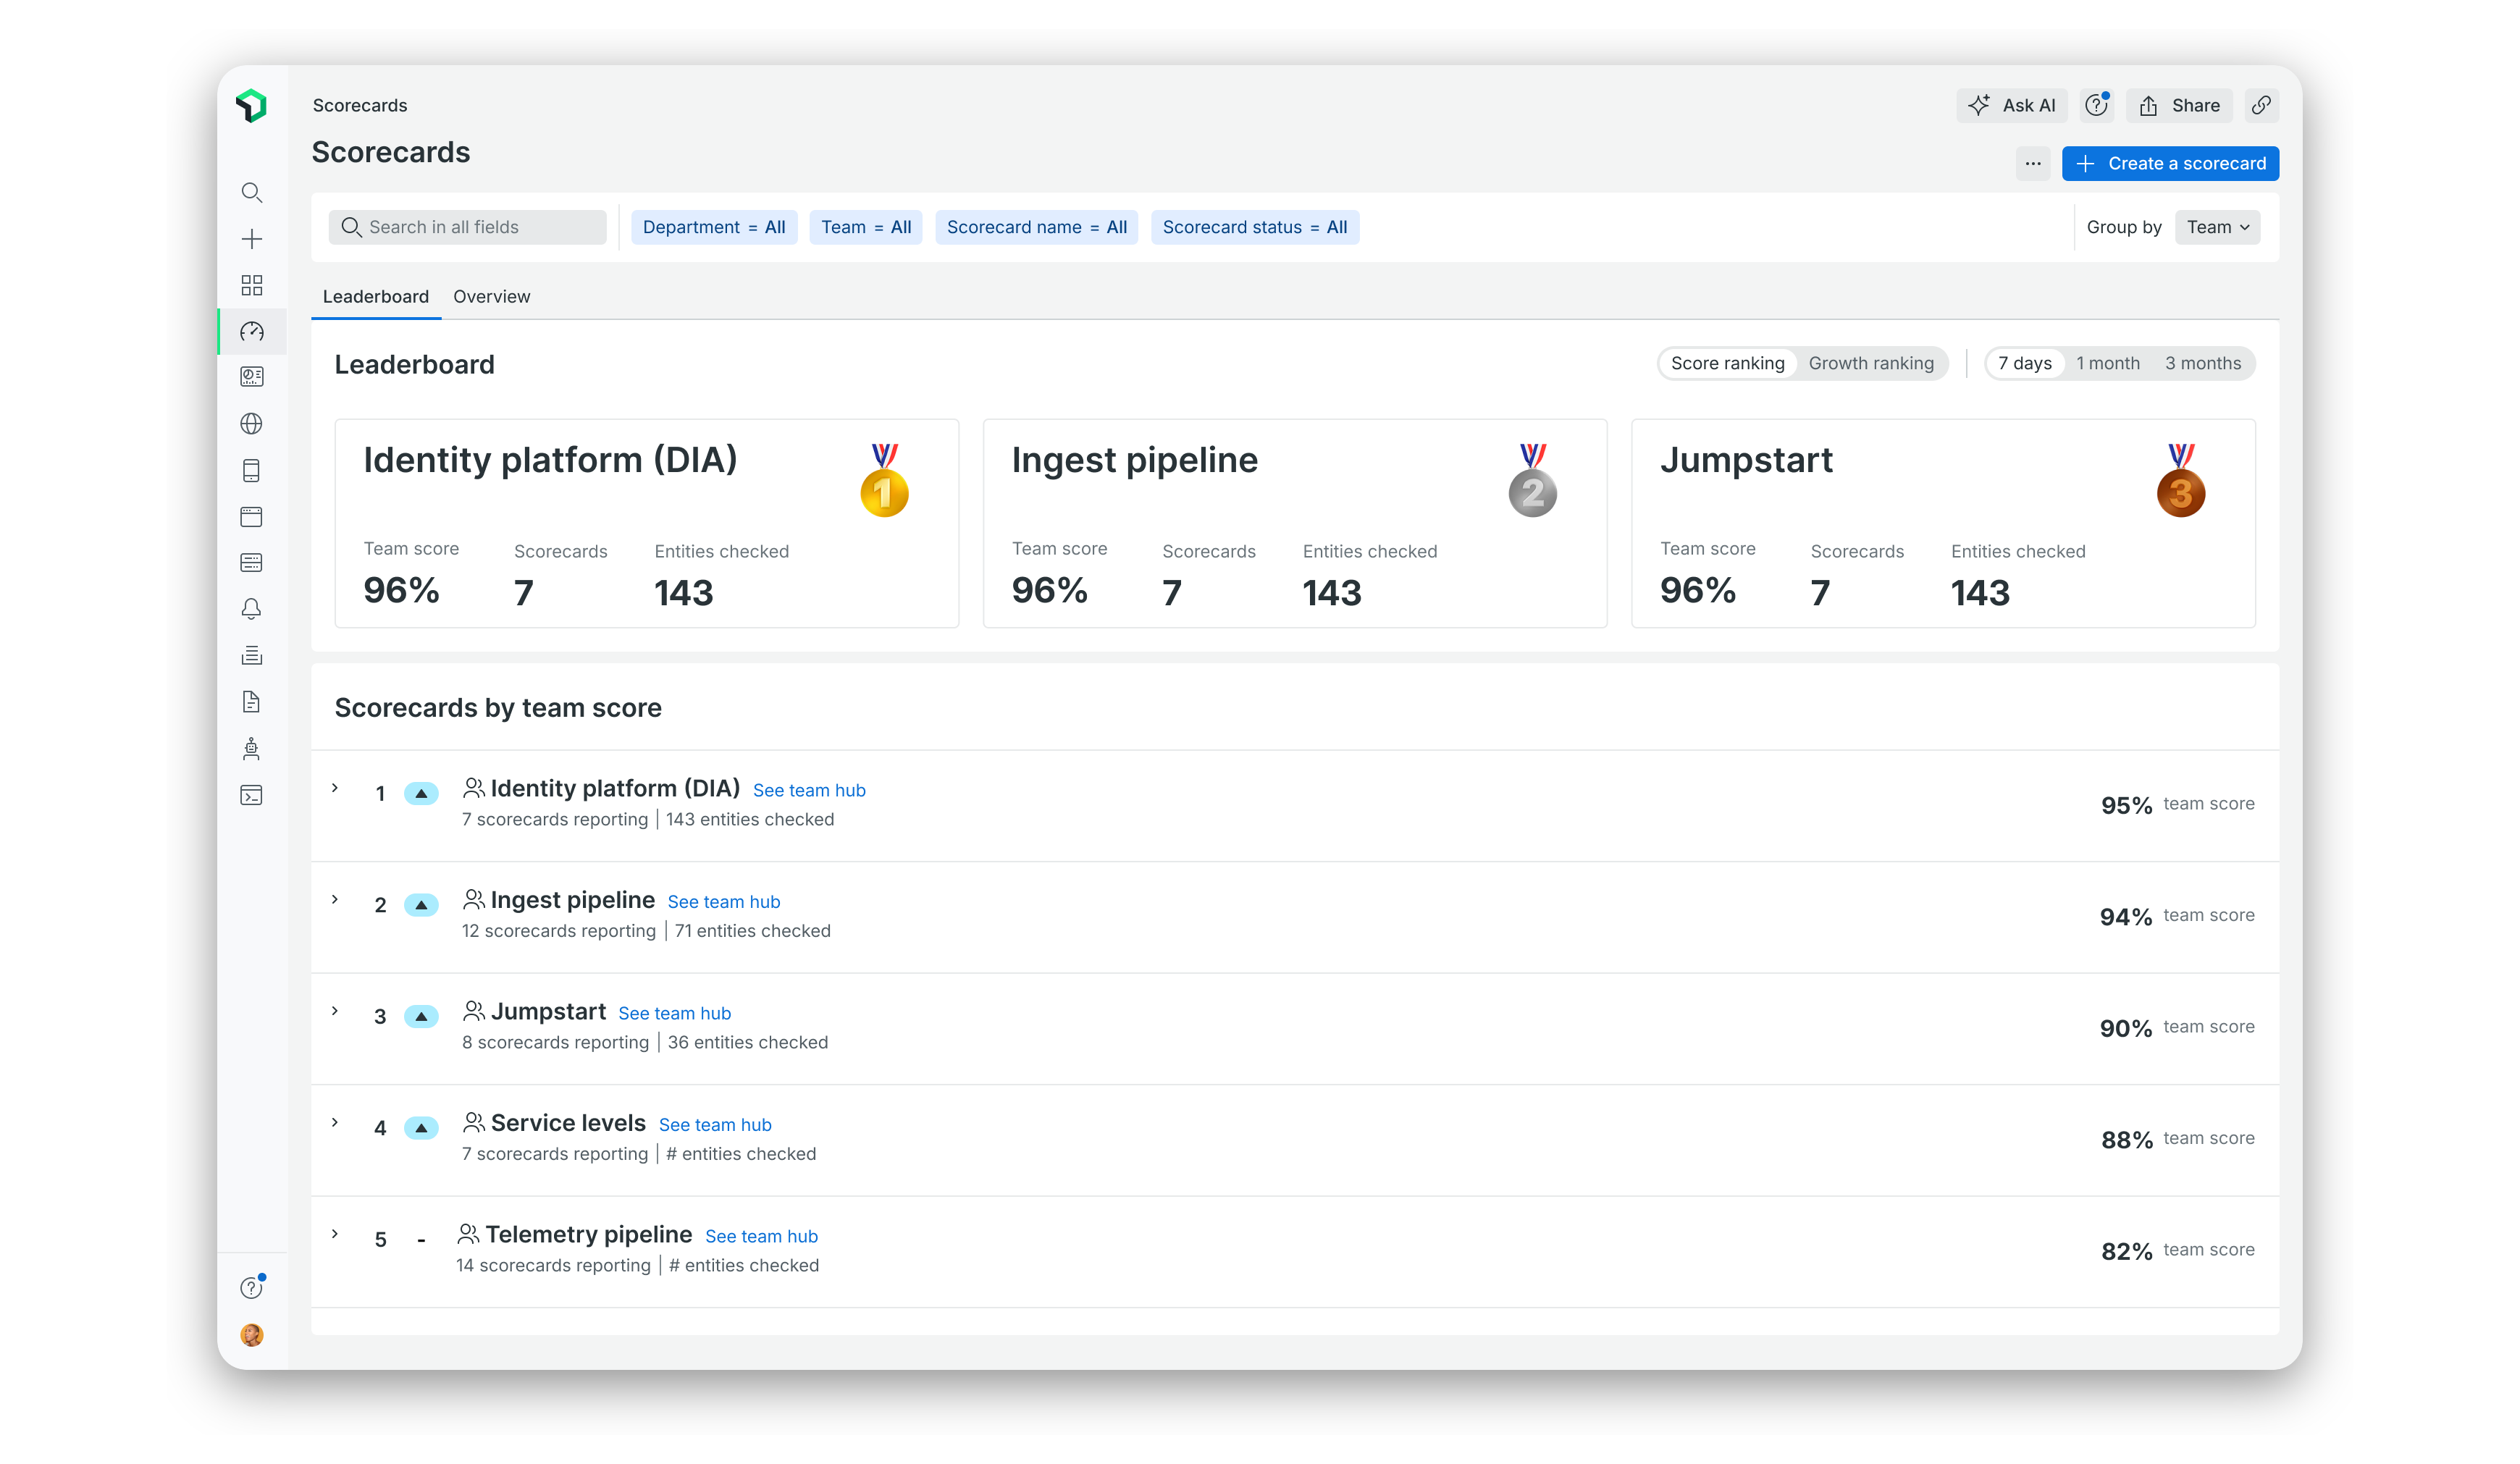
- Team leaderboard — teams ranked by one accumulated score to foster healthy competition and drive operational excellence.
- Entity progression & reporting — maturity distribution, per-entity profiles, and rule performance over time show where each service stands and where to invest next.
Shipped
Group by team
Switching Group by from None to Team is what turns individual scorecards into a team-level leaderboard.
Podium spotlight
The top three teams get a medal, a team score, and how many entities they cover, so recognition is instant.
Score vs. growth ranking
A toggle separates who's highest right now from who's improved the most, so leading and improving don't get confused.
7 days / 1 month / 3 months
Switching the time window shows whether a team's climb is a blip or a real trend.
Outcomes and reflection
“The distinctions between basic, intermediate, and mature… that's my favorite thing. It helps teams not try to do everything all at once, in any order. There's a sequence to this, and a measured way to do it.”
If I could redo one part of this, I'd have the data-model conversation with Engineering before sketching anything, not after a scrapped first pass. Benchmarking competitors was useful, but building toward their pattern before checking it against our own model cost real time.